How To Debug Microcontroller Easily
You are an embedded firmware developer, you have a board and there is a problem as always, and you want to know what is wrong in there. Welcome to the club of desperate engineers! And good news, there is a solution that can make your life much easier ✨✨✨
Using BigBug you can print messages to track your software, as many as you want, and with a very small impact on CPU time. BigBug is a remote printf tool that needs only a serial port connection but no debugger.
Definition of the Problem
Embedded systems, especially the ones that don’t provide a user interface and any measure of display, are very tricky to debug on-site. Without a debugger, your device is nothing more than a black box. Even when you have option to connect a debugger, the possibility that the behavior changes when you connect it is not one in a million. There are also situations that you don’t want to interrupt the program flow in any case while some others face very nasty problems that don’t show up for days.
Top Solution Approaches
Every professional finds its own way of debugging and the most general approach is to have a backdoor in the device, that is sometimes activated by a key combination secret to the manufacturer. UART serial port is a good choice of a backdoor and is used widely in the industry. Some manufacturers have their own protocol or physical layer like ultrasound or optical communication.
Event Logging
If you have this kind of backdoor, you can send some parameters or event logs to a client computer. It is a perfect idea to send function entry messages, RTOS task switching logs or even measurements from various sensors. Any sort of useful information that will help identifying future problems. Think about the sample log of an automatic door below.
ACME Automatic Door Driver Starts...
Self test is running...
Trying to open...OK
Trying to close...OK
Reading motion sensors...
Motion sensor-1...returned 103 (expected <= 128)...OK
Motion sensor-2...returned 117 (expected <= 128)...OK
Self test OK
Sleeping...
IRQ5: Reading sensor-1...returned 101
Sleeping...
IRQ7: Reading sensor-2...returned 190 (threshold = 150)
Door opening triggered...
OpenTask: Opening...OK
CloseTimer initialized to 10s.
Sleeping...
CloseTimer overflow.
Door closing triggered...
CloseTask: Closing...OK
It looks like paradise, right? In fact, this amount of messages are extremely impractical for microcontrollers. The biggest reason for that is the communication speed. Each character in the message takes roughly 1ms on a 9600-baud UART and it means the logger task will be blocked about 10ms to 100ms to send a log. I know that UART can be much faster and background transmission using large buffers are also possible but sooner or later this limitations will introduce a bottleneck for your application that forces you to reduce the number and quality of your logs. There is no way of logging without disturbing the flow with this approach.
Debugging with BigBug
By using BigBug, you print exactly the same log messages I gave above with a single difference: you don’t have to print them all. What you need to send over UART is something similar to the following.
AS
TS
OO
CO
Rs
Rs1 103 128
Rs2 117 128
TO
Sl
IR5 101 150
Sl
IR7 190 150
Op
OP
Tc10
Sl
TC
Cl
CL
Full logs are still available with less amount of data transferred to the computer.
Usage Details
You need to have your device communicate to your computer over serial port where only TX (transmission from device to computer) is sufficient and baud rate is configurable.
Explanation of data format
BigBug scans a file or folder to detect the user-defined descriptors of a special format to know what does every short code mean. Check the user source-code line below.
puts("HE");//@BB[HE] Hello World!
Here is a simple C code to send HE\n string to serial port (low-level implementation is not given) and the comment of the line is BigBug descriptor that tells HE (followed by line terminator) means Hello World! You can also send parameters/values using proper descriptors.
At this point, I strongly encourage you to check the detailed README on the GitHub page.
Simple Example Project
I will start with the most basic example rather than details. I wrote a few lines of code for micro:bit board to communicate with BigBug. Check the following example.
serial.writeLine("HE")//@BB[HE] Hello World!
serial.writeLine("Ss")//@BB[Ss] Starting animation.

basic.forever(() => {
    serial.writeLine("TO")//@BB[TO] Toggling LEDs.
    led.toggleAll();

    serial.writeLine("AR")//@BB[AR] Reading Accelerometer...
    let x: number = input.acceleration(Dimension.X)
    let y: number = input.acceleration(Dimension.Y)
    let z: number = input.acceleration(Dimension.Z)

    //@BB[AV] Accelerometer Values: X={0} Y={1} Z={2}
    serial.writeLine("AV" + x + " " + y + " " + z)
})

input.onGesture(Gesture.Shake, () => {
    serial.writeLine("GE0")//@BB[GE] Gesture.{0:(0)Shake,(1)ScreenUp,(2)ScreenDown}
})

input.onGesture(Gesture.ScreenUp, () => {
    serial.writeLine("GE1")
})

input.onGesture(Gesture.ScreenDown, () => {
    serial.writeLine("GE2")
})
- Lines 1, 2, 5 and 8 are of the simplest form just like explained above. The 2 letter shortcodes inside the square brackets @BB[..] are expected from the device. Once they are received (followed by line termination characters \n or \r\n) the message in the descriptor will be displayed on the screen.
- Line 13 is another descriptor which has 3 payloads in addition to the message. Assuming the acceleration values are x=1.25, y=10.9 and z=-2.7, device will send (line 14) AV1.25 10.9 -2.7\n and this will be interpreted (on PC) as Accelerometer Values: X=1.25 Y=10.9 Z=-2.7.
- Similarly line 18 has a description of enumerated type. Payload will be replaced by one of the values; Shake if 0 is received, ScreenUp if 1 is received, ScreenDown if 2 is received. In the example code, line 18, 22 and 26 populate this description with values.
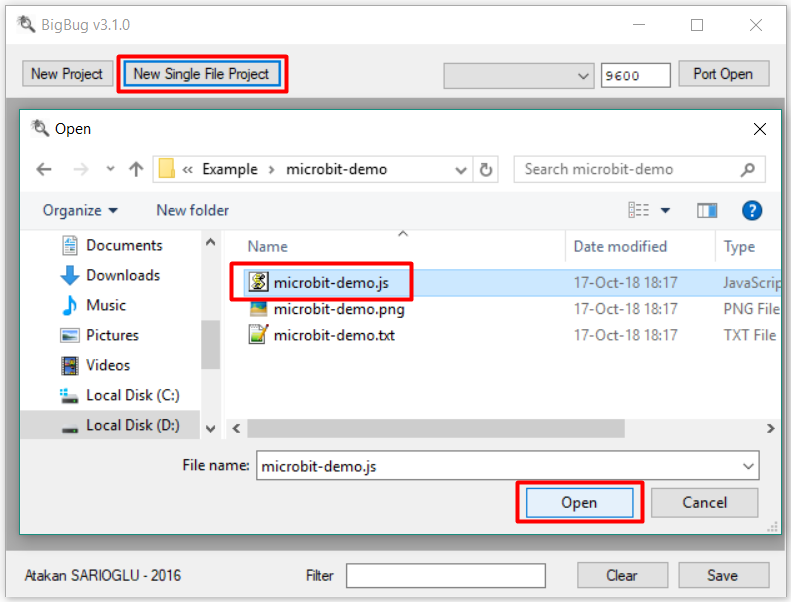
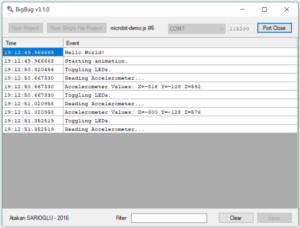
If you have a micro:bit, go to Let’s Code page, copy-paste the code above and generate hex file to upload to your board. That’s all 🙂 Also save the code into a text file on your computer. Download the latest BigBug.exe and run it. Click “New Single File Project” and show the text file that you saved. Now it is ready. After you set the correct port and set the baud rate to 115200, click “Open Port” to connect. You will see the messages are coming. You can apply a filter if you wish.
Don’t worry if you have no micro:bit. You can simulate the above example using BigBugTester.exe (You will also need com0com software to create virtual serial ports on your computer).
Final Words
You can easily use it in your projects and I believe the GitHub page explains all necessary details for integration. This project is an effort to enable easy debugging and by now it saved me and some colleagues lots of time. Now it is public and any sort of contribution is welcomed for sure.


